


.png)
 - Vertical.png)
.png)
 - Vertical.png)
.svg)
.png)
CIE Standard Observer
Due to the distribution of cone cells in the eye, the Tristimulus values depend on the observer's field of view. Standard (Colorimetric) Observer is a color mapping function designed to eliminate this variable, by representing a human's average chromatic response within a \(2\degree\) arc inside the fovea.
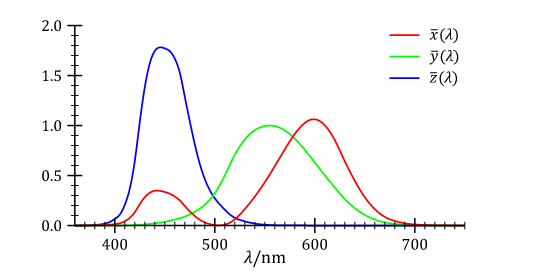
It consists of the set of colour matching functions \(\bar{r}(\lambda),\bar{g}(\lambda),\bar{b}(\lambda)\) for the CIERGB space and \(\bar{x}(\lambda),\bar{y}(\lambda),\bar{z}(\lambda)\) for the CIEXYZ space.
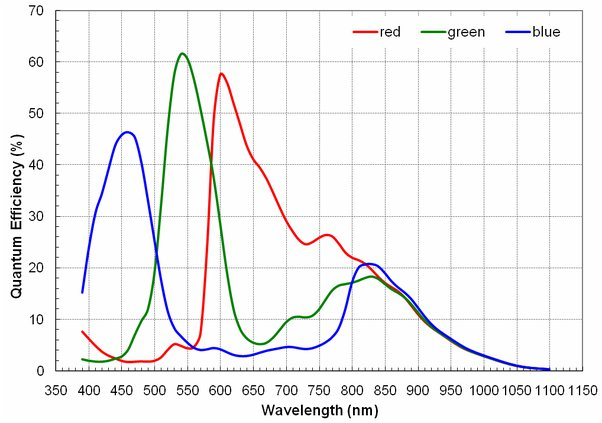
CIE's colour matching functions are the numerical descriptions of the chromatic responses of the observer. They can be thought of as the Spectral Sensitivity curves of three linear light detectors yielding the Tristimulus values X, Y and Z.
The CIE 1931 RGB Colour Space was defined using the RGB tristimulus values derived from these mapping functions. Similarly, the CIE 1931 XYZ Colour Space was defined using the XYZ tristimulus values derived from the standard observer mapping functions.
Later, it was discovered that the cones covered a larger field of view than previously believed. The visual matching experiments were repeated by W. S. Stiles, J. M. Burch and N. I. Speranskaya using this wider field of view and in 1964, the CIE 10\(\degree\) Standard Observer was published. The CIE 10\(\degree\) standard observer is recommended by the CIE for representing the spectral response of humans and also for most industrial colour applications, but the 1931 2\(\degree\) standard observer remains available due to its incorporation in many industry product specifications.
In summary, the variants are:
- CIE 1931 \(2\degree\) RGB Standard Observer
- CIE 1931 \(2\degree\) XYZ Standard Observer (some sources also cite it as 1932)
- CIE 1931 \(2\degree\) Standard Observer
- CIE 1964 \(10\degree\) Standard Observer
Derivation
Derivation of the CIE RGB colour matching functions
It was defined by two independent experiments in 1920 by W. David Wright with ten observers and John Guild with seven observers.
On the basis of these experiments, three colour matching functions were formed. These results were summarized and standardized as the CIE RGB colour matching functions \(\bar{r}(\lambda)\), \(\bar{g}(\lambda)\) and \(\bar{b}(\lambda)\), obtained using three monochromatic primaries at standardized wavelengths of 700 nm (red), 546.1 nm (green) and 435.8 nm (blue).
Note that \(\bar{r}(\lambda)\) and \(\bar{b}(\lambda)\) are zero at 435.8 nm, \(\bar{r}(\lambda)\) and \(\bar{r}(\lambda)\) are zero at 546.1 nm and \(\bar{g}(\lambda)\) and \(\bar{r}(\lambda)\) are zero at 700 nm, since in these cases the test colour is one of the primaries.
The wavelengths 546.1nm and 435.8 nm were chosen because they are easily reproducible monochromatic lines of a mercury vapour discharge. The 700 nm wavelength, which in 1931 was difficult to produce, was chosen because the eye's perception of colour is rather unchanging at this wavelength, and therefore small errors in wavelength of this primary would have little effect on the results.
The cut offs at the short and long wavelengths were chosen somewhat arbitrarily. The human eye can actually see upto 810 nm, but with a sensitivity that is thousands of times less than that for green light.
This created a problem with the \(2\degree\) colour mapping function that contributions of shorter blue wavelengths were underestimated. This led to the development of more perceptually linear Uniform Colour Spaces. There were also corrections by Judd (1951) and Vos (1978) without deviating from the original methodology.
Analytical Approximation
The functions were distributed as a discrete lookup table by the CIE. But table lookup can be impractical for some computational tasks. Instead, they can also be approximated as a sum of Gaussian functions (Refer Wikipedia).
Derivation of the CIE XYZ colour matching functions
It is mentioned here: CIE 1931 XYZ Colour Space